New study validates accuracy in predicting the first wave, but weakness in forecasting ‘trailing’ waves
Residents of coastal towns in Chile remember the catastrophic earthquakes that struck their country in 1960 and 2010, not always for the quakes themselves but for the tsunamis that followed.
Those who survived the 9.5-magnitude 1960 quake told interviewers about the man in Maullin, Chile who, after the first wave of the tsunami, rushed into his dockside warehouse to retrieve possessions just as the second wave hit. The second wave swept the warehouse out to sea and the man was never seen again. Similarly, waves following the first one, known as trailing waves, made post-tsunami rescue efforts in 2010 life-threatening.
In 2010, society had better tsunami-warning technology than in 1960, but weaknesses still existed. New research by geophysicists at Scripps Institution of Oceanography at UC San Diego reveals the strengths and shortcomings of tsunami early warning systems as experienced in the 2010 episode. The study is representative of much of scientific research in that it does not create new prediction tools but contributes to assessing the reliability of existing methods. The scientists hope the work can improve predictions of trailing tsunami waves.
Ignacio Sepulveda Oyarzun, a postdoctoral fellow at Scripps Oceanography who himself survived the 2010 Chile earthquake, and colleagues found a weakness based on inaccurate estimates of bathymetry, which is the topography or depth of the seafloor. That inaccuracy doesn’t matter so much when an initial, or leading, tsunami wave hits because of its sheer size, but trailing waves have short enough wavelengths that they are considerably more influenced by the shape of the seafloor over which they travel on their way to coastlines. Trailing wave forecasts are severely affected by bathymetry errors, said study authors, with wave amplitude uncertainties off by as much as 35 percent.
Sepulveda said there is good news in this work in that it validates the accuracy of leading tsunami wave warnings, but he also provides the caveat that people need to stay away from coastal areas for several hours after the initial wave because of the unpredictability of what happens next.
“We have wondered about the impact of bathymetry errors on tsunami models for a long time because bathymetry data is a critical input of the models,” said Sepulveda. “With this new study, we are now able to answer valuable questions about the reliability of tsunami warnings and hazard assessments.”
Science’s best guesses about the location of seafloor features like seamounts or canyons or reefs and their dimensions come from soundings, which are physical measurements of the distance between the surface and the ocean bottom at a given location. Soundings are made by ships, but the process is expensive. In part because of the high price tag, only about 11 percent of the ocean bathymetry has been measured in this fashion.
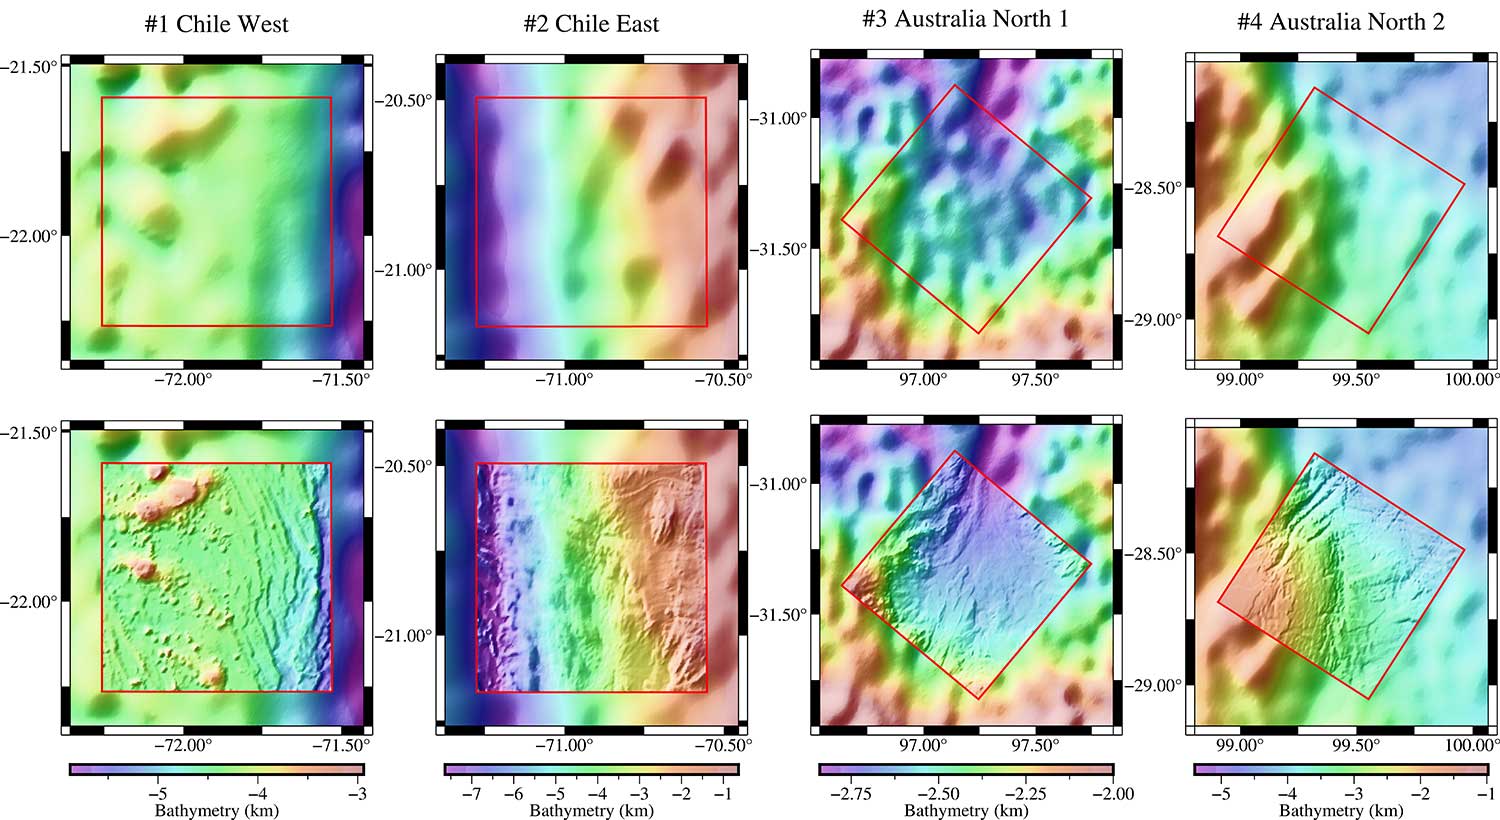 A comparison of an altimetry-predicted bathymetry model (top) and ship-board multibeam measurements (bottom) in four different regions show the altimetry-based model cannot capture the fine-scale features of the real bathymetry.
Estimates of what the other 89 percent of seafloor look like are derived from altimetry measurements made by satellites of the height of the ocean surface. Satellites infer what the gravitational pull is at any given point; the greater the gravity, the higher submarine seamounts must be.
This method has been used over the years by researchers at Scripps Oceanography who supply ocean data to Google Maps, among other users, to fill in the blanks. Bathymetry data feed into what scientists call numerical models, or simulations that also rely on mathematics and hypotheticals” to estimate likely tsunami behavior. Errors in altimetry data can cause satellite-derived estimates of elevation to be off by several hundred meters.
“While satellite altimeters provide this global perspective on seafloor depth, they lack the accuracy and resolution that is obtained by multibeam echosounders aboard large research vessels such as [Scripps Research Vessel] Sally Ride,” said Scripps Oceanography geophysicist David Sandwell.
Sepulveda’s team created a new model by analyzing bathymetry data collected from several locations around the world and calculating how far off those data are from reality. The model they created then generates a margin of error estimate that can be used to inform a range of other oceanographic models, including tsunami propagation models.
They used the model to look at past tsunamis and found that the leading wave generally has a wavelength so large that any bathymetry errors do little to affect it. Trailing waves, which come minutes or hours later, have shorter wavelengths, placing them on a scale more comparable to the size of bathymetry errors. Those bathymetric features can magnify or attenuate the waves in myriad ways, as can their interaction with normal breaking waves.
In Chile, many coastal towns are built around bays, which provide natural protection from storms most of the time. But when trailing tsunami waves strike, those same geographic features can focus the energy of the waves, creating waves that are larger than the first, and more localized. That was the case in 2010, where residents of the fishing village of Dichato, Chile recalled that it was the third tsunami wave that swept the town away, several hours after the 3:30 a.m. quake.
“The systematic study comparing detailed sea beam surveys of bathymetry and satellite derived bathymetry highlights the differences that can have a big impact for mitigating hazards from the secondary and trailing waves from tsunamis,” said study co-author Jennifer Haase, a geophysicist at Scripps Oceanography. “It can also be useful for many other ways that satellite derived bathymetry is used, for example understanding ocean currents.”